What happened when my project got on top of Hacker News
This is analysis how much traffic I got from being on front page of hacker news, how it spreaded accross other social media. From which countries people came and what operating system and browser they use.
Few days ago, I have noticed, that people are posting about unix timestamp approaching 1.5B. Websites that they have linked were displaying either just current timestamp or time remaining in seconds. So, I was thinking, that this could be opportunity for my website Timestamp Converter Online. So, I put together simple page, which is showing timestamp countdown in more human readable form.
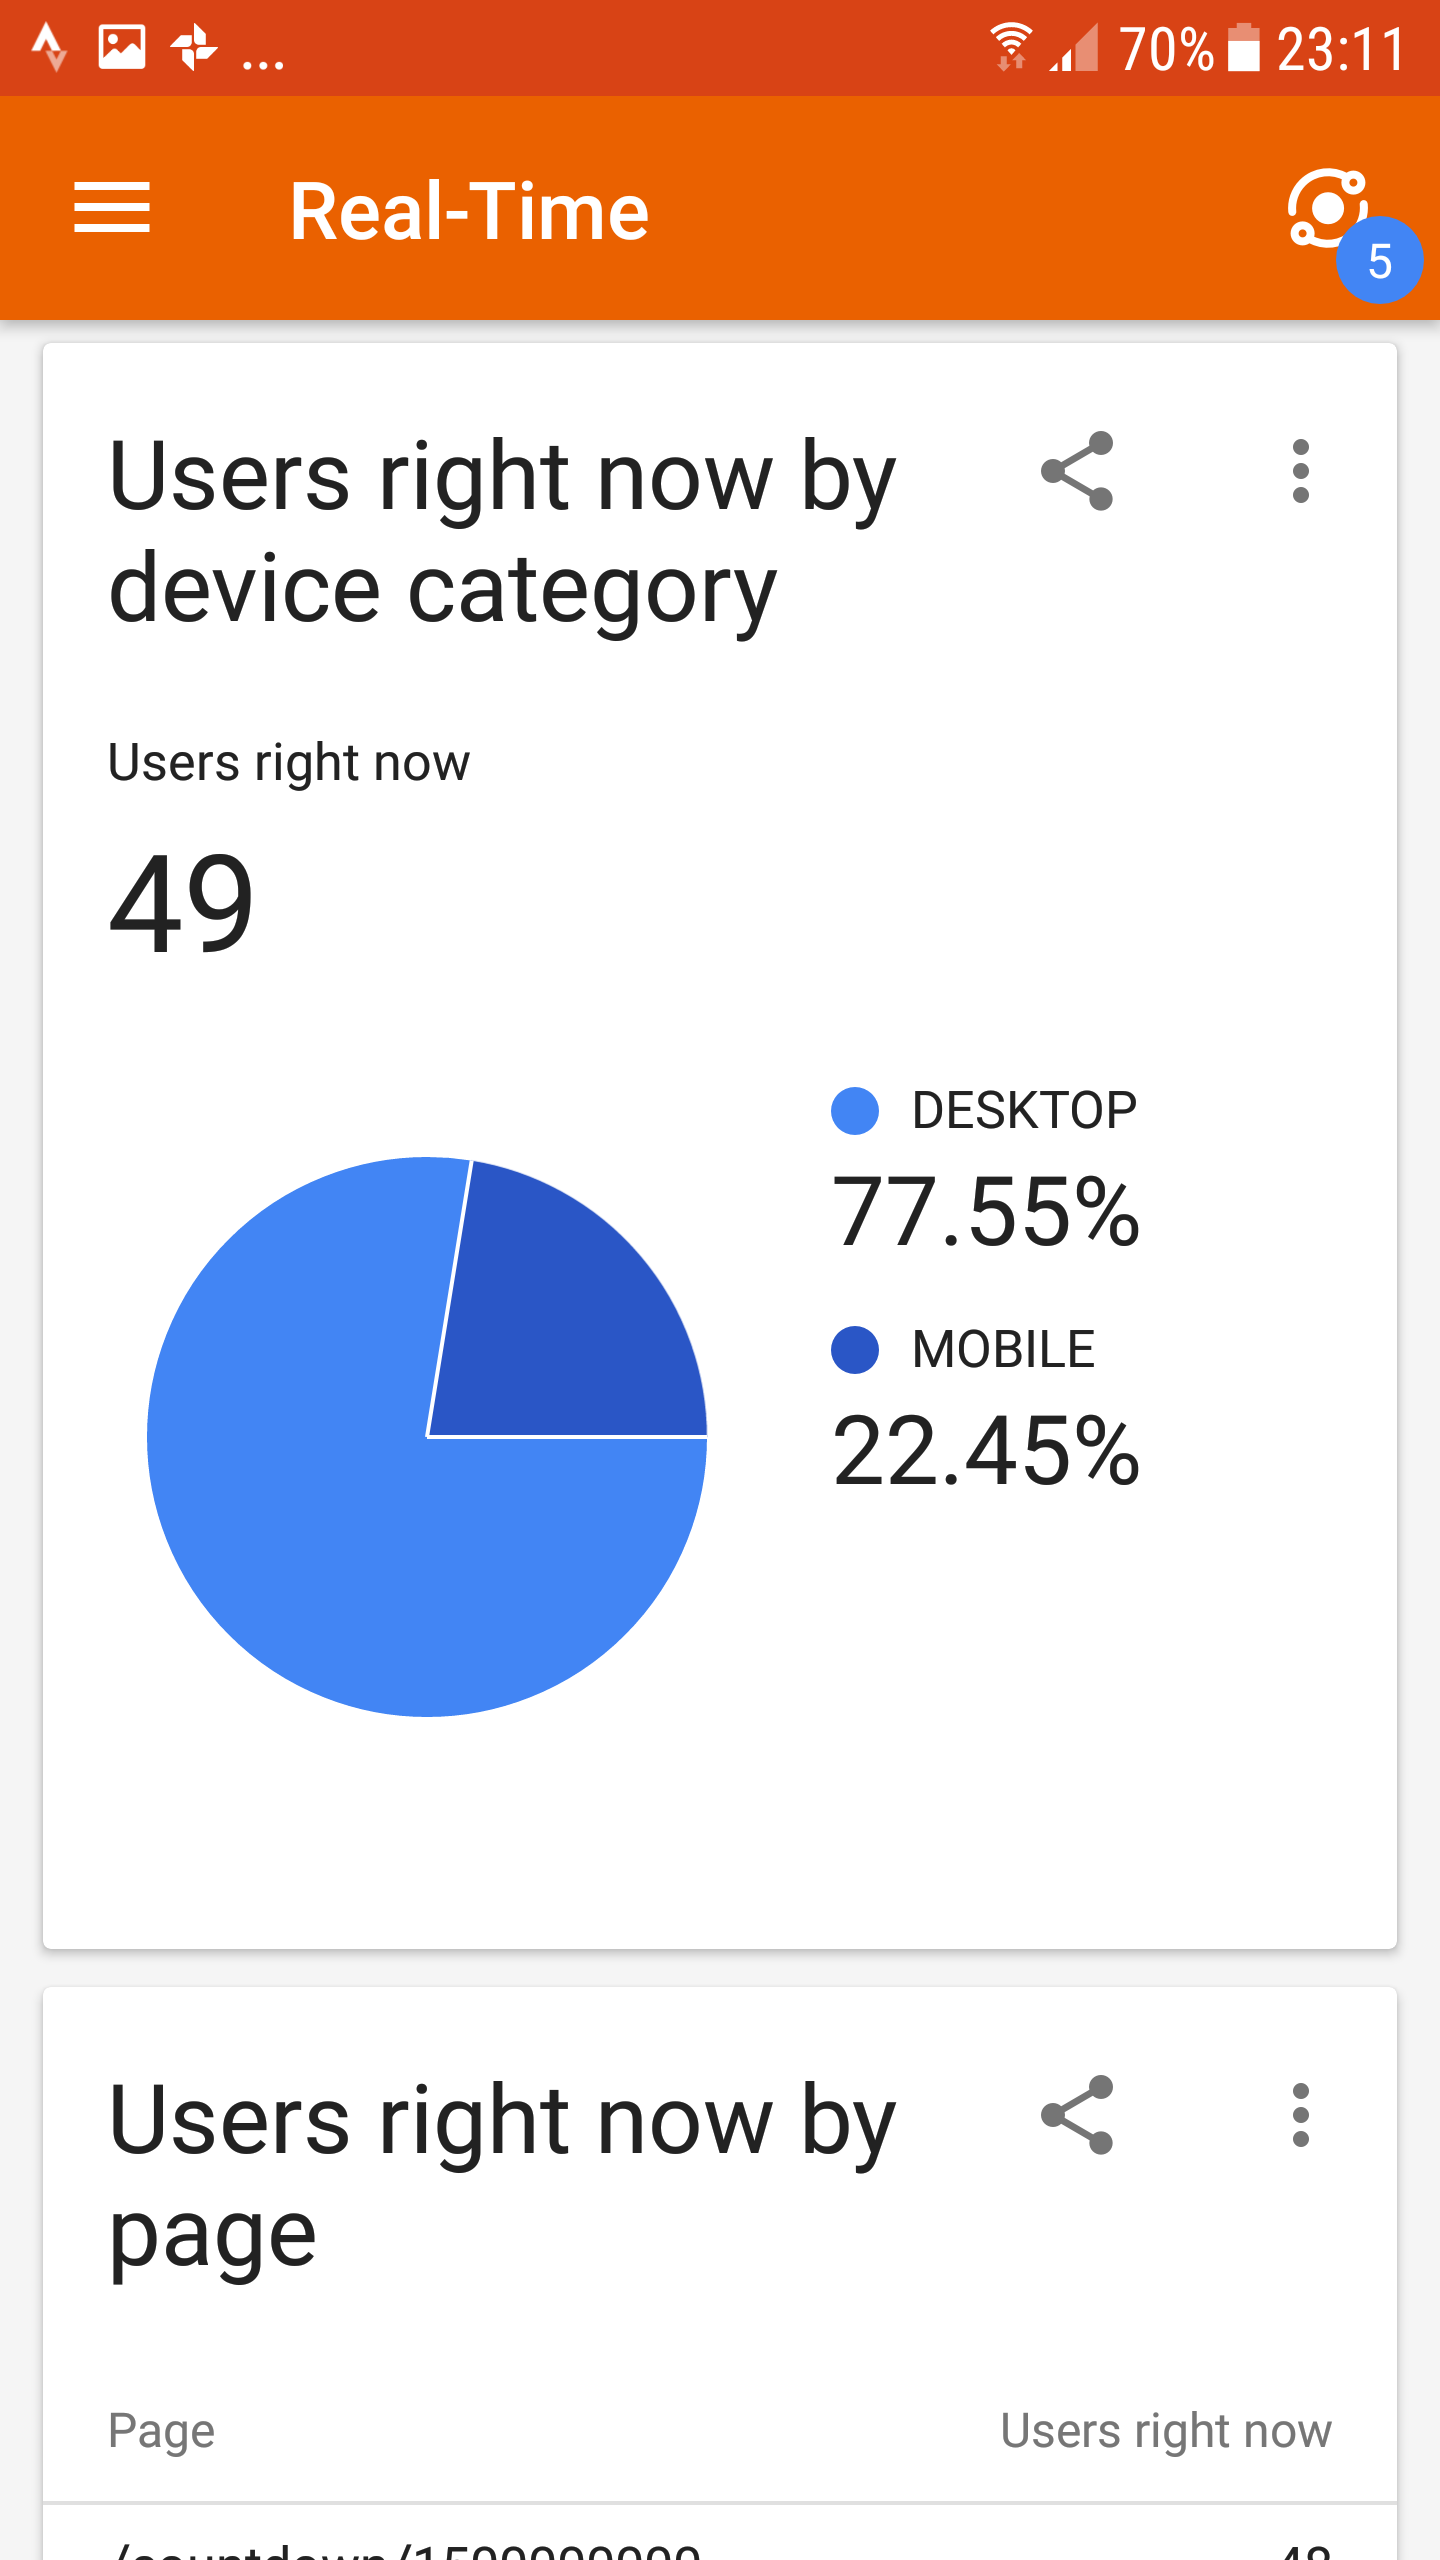
I have submitted it to hacker news at around 23:00 my local time and I had very low expectations about getting any upvotes so I went to bed. However, when I have checked Google Analytics, I was shocked. There was 49 people on my website. This website have 5 users per day – which were mostly unrecognized bots.
Timeline
These are random snapshots when I have checked what is going on hacker news and on my website.
- 2017-07-13 23:11:39 – 49 users – big surprise:
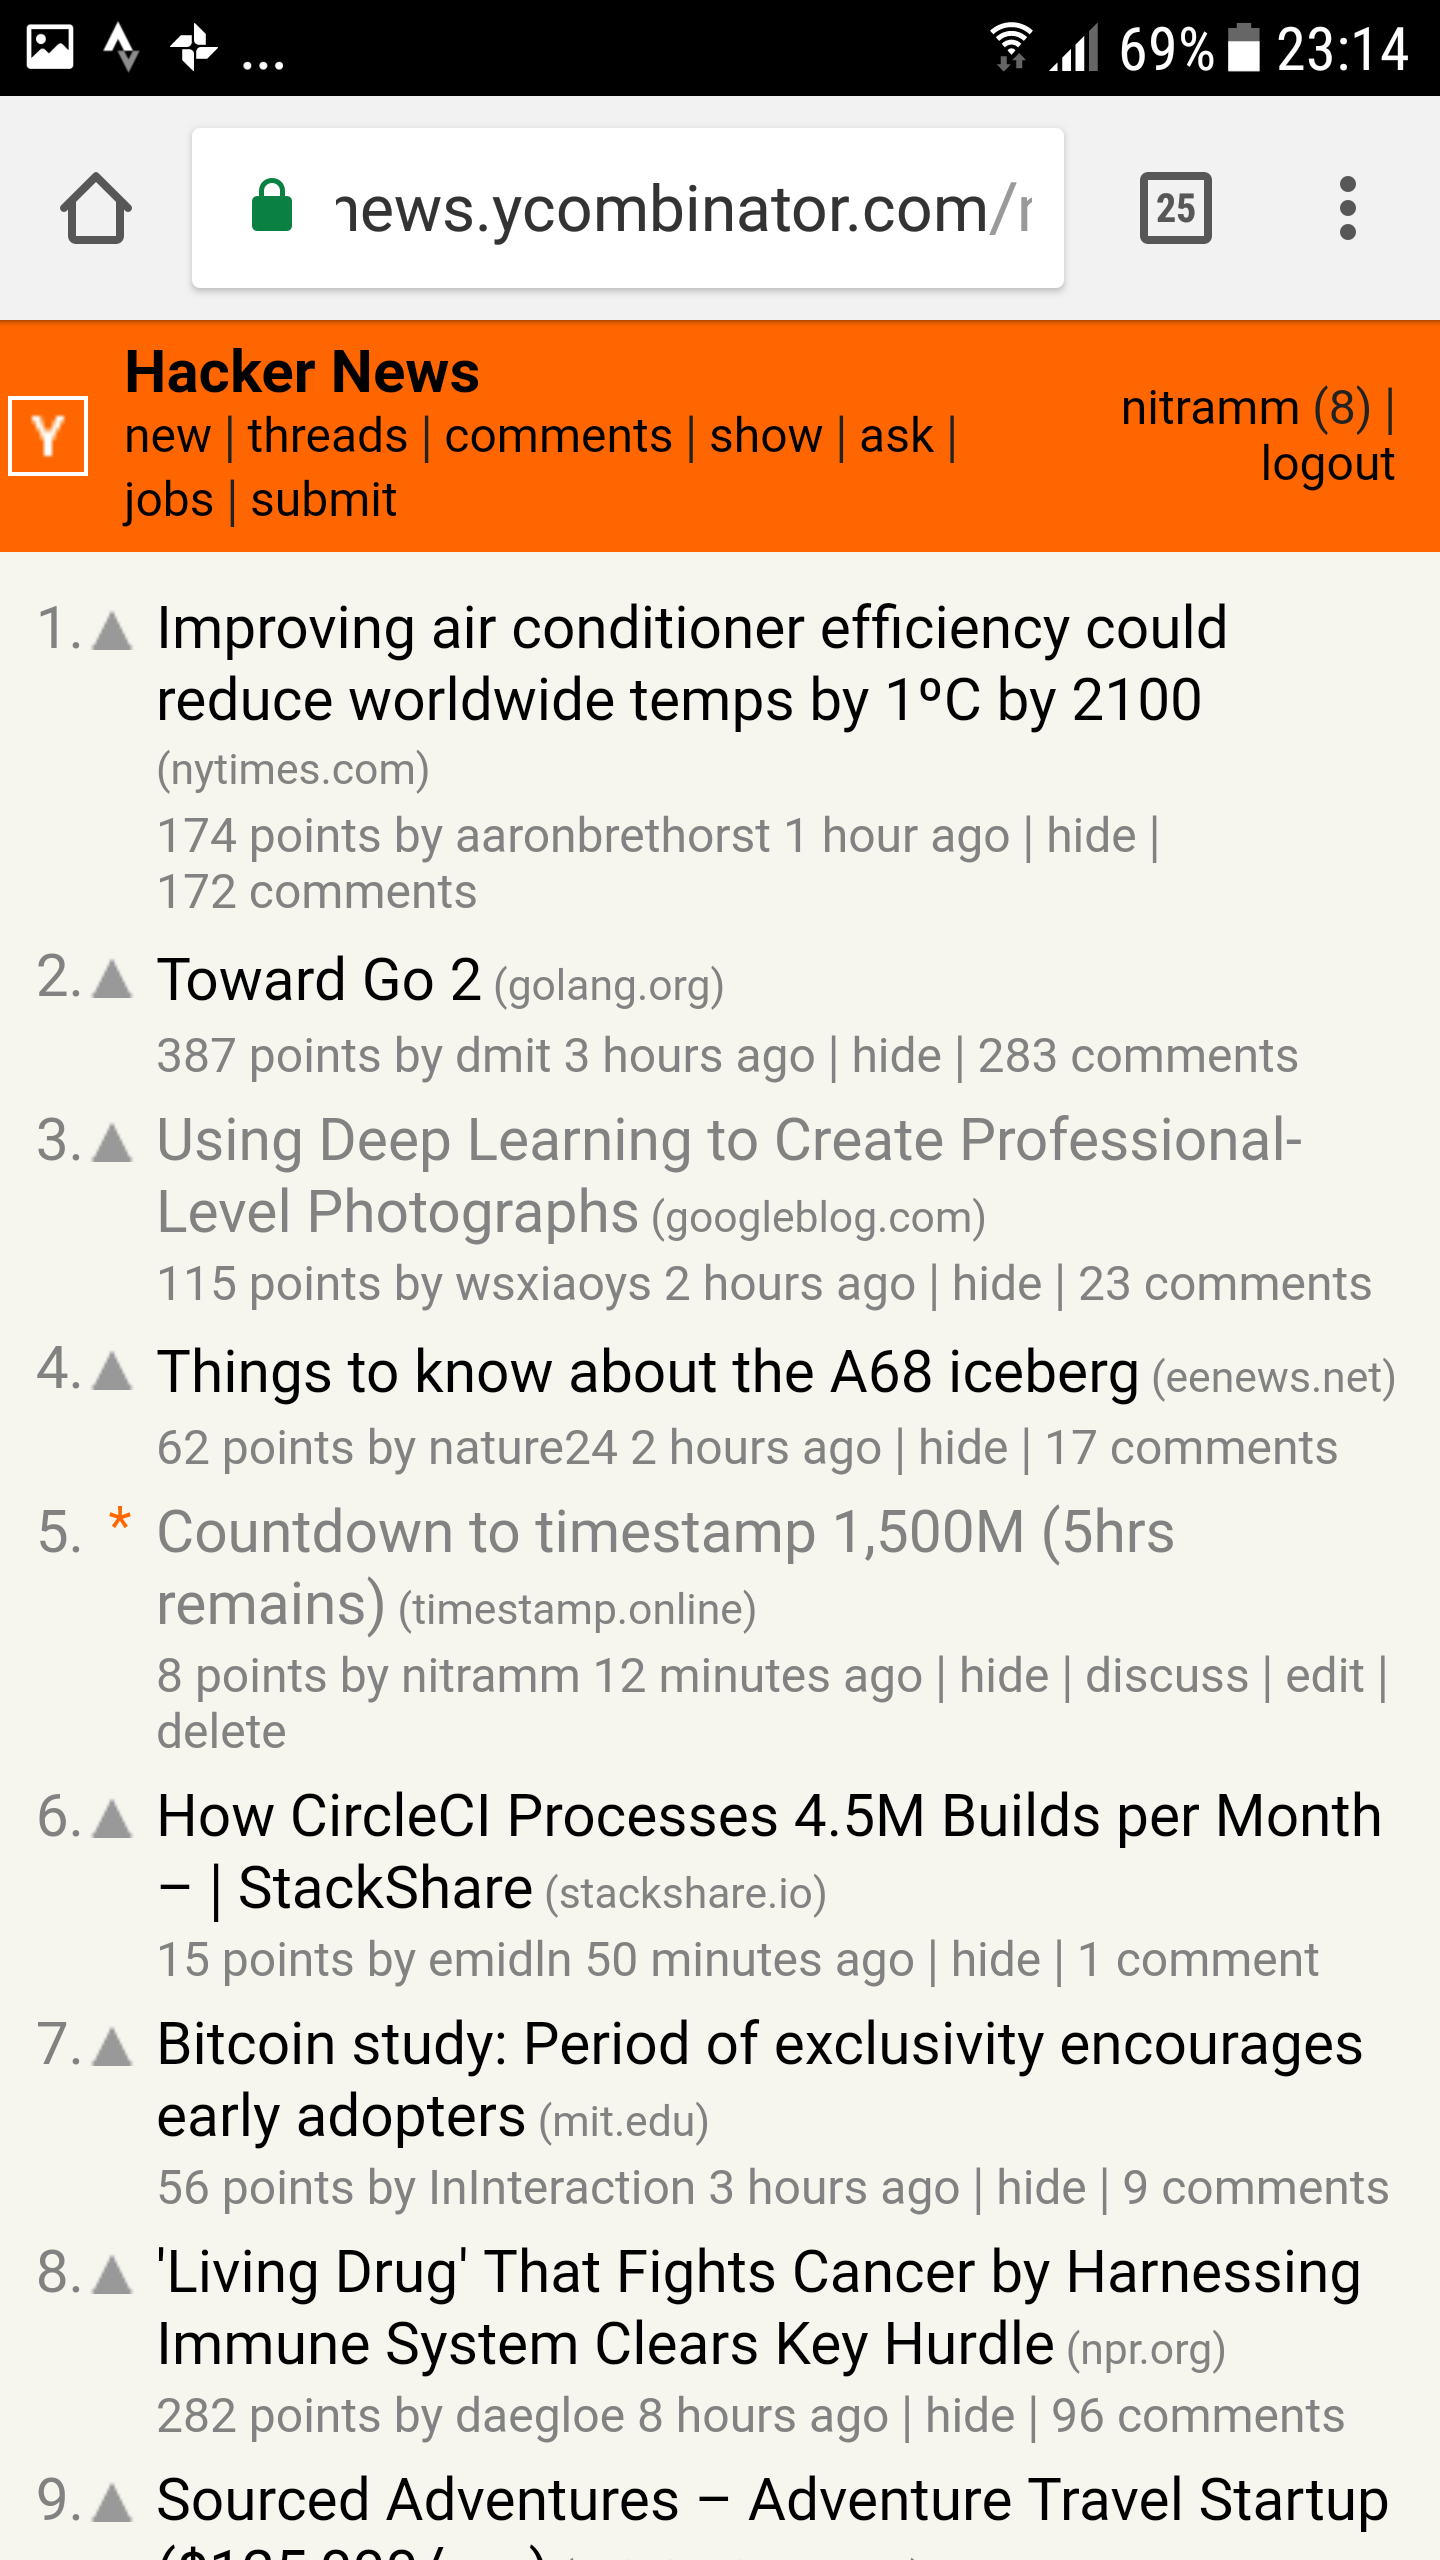
- 2017-07-13 23:14:36 – 5th position and I was surprised by their ranking algorithm:
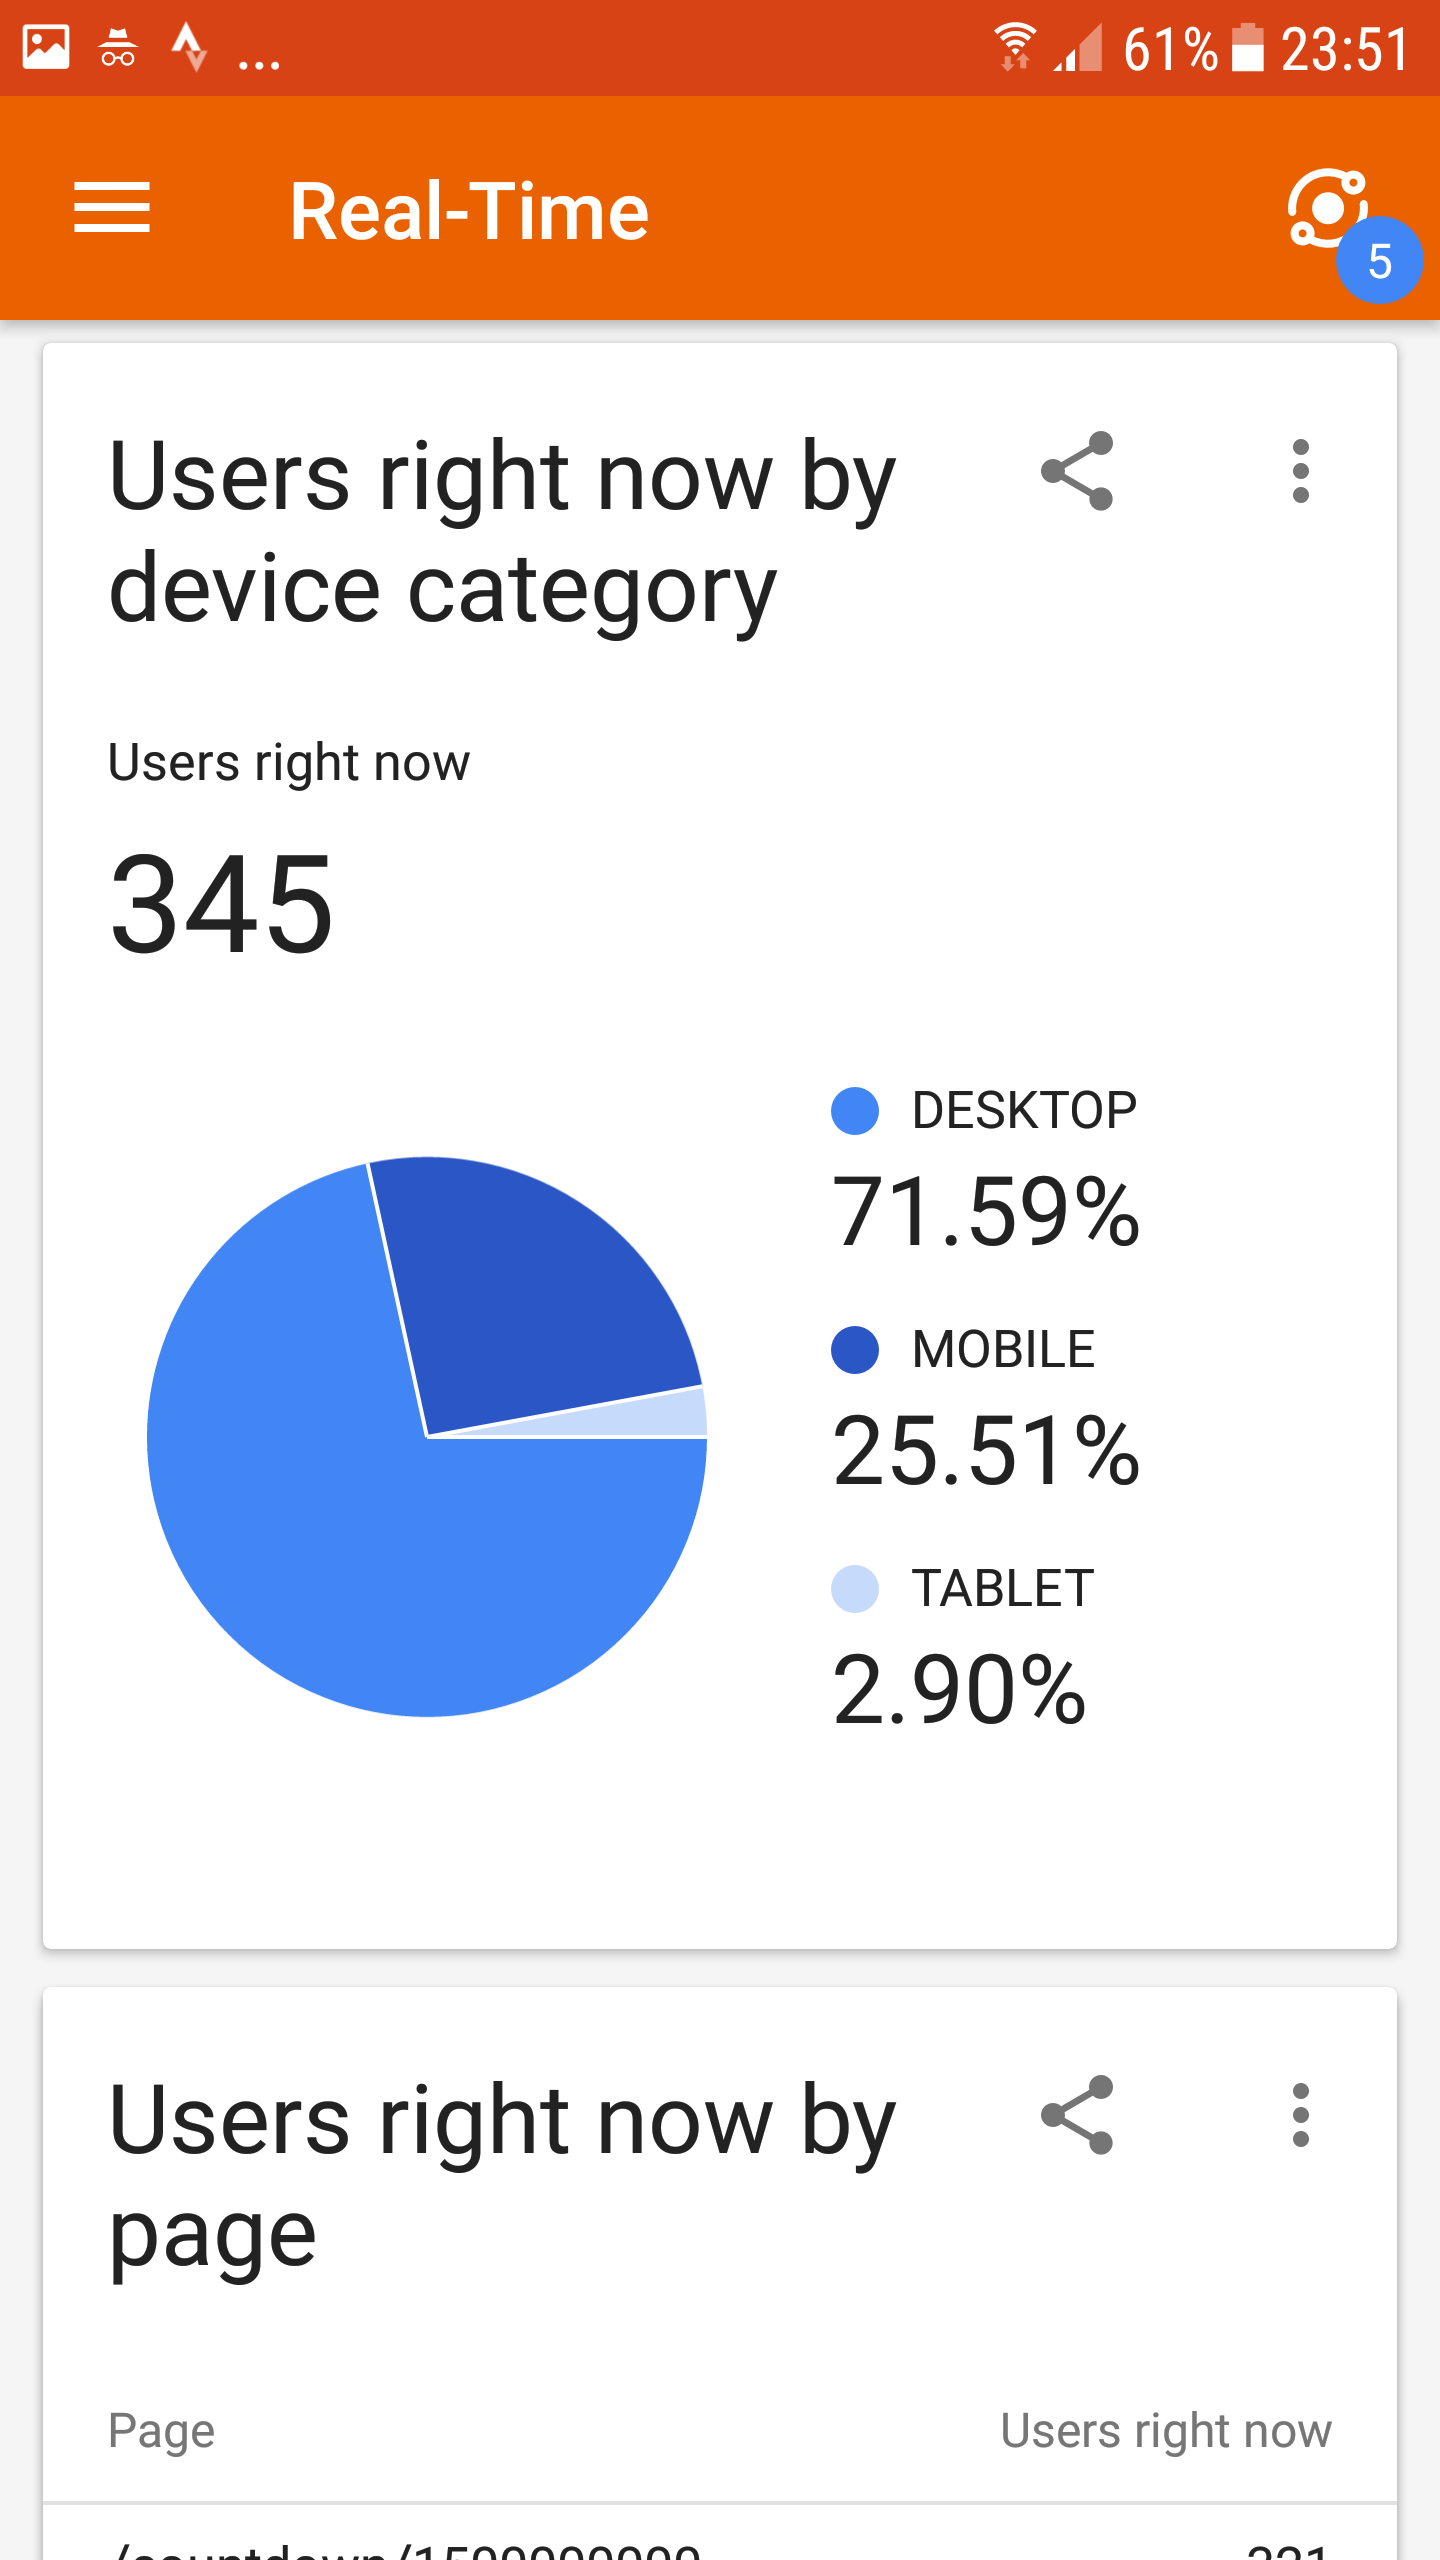
- 2017-07-13 23:51:27 – 345 users is maximum that I have seen:
- 2017-07-13 23:53:35 – 2nd position, this was the best that I have seen:

- 2017-07-14 00:08:13 – Number of current users was slowly decreasing:
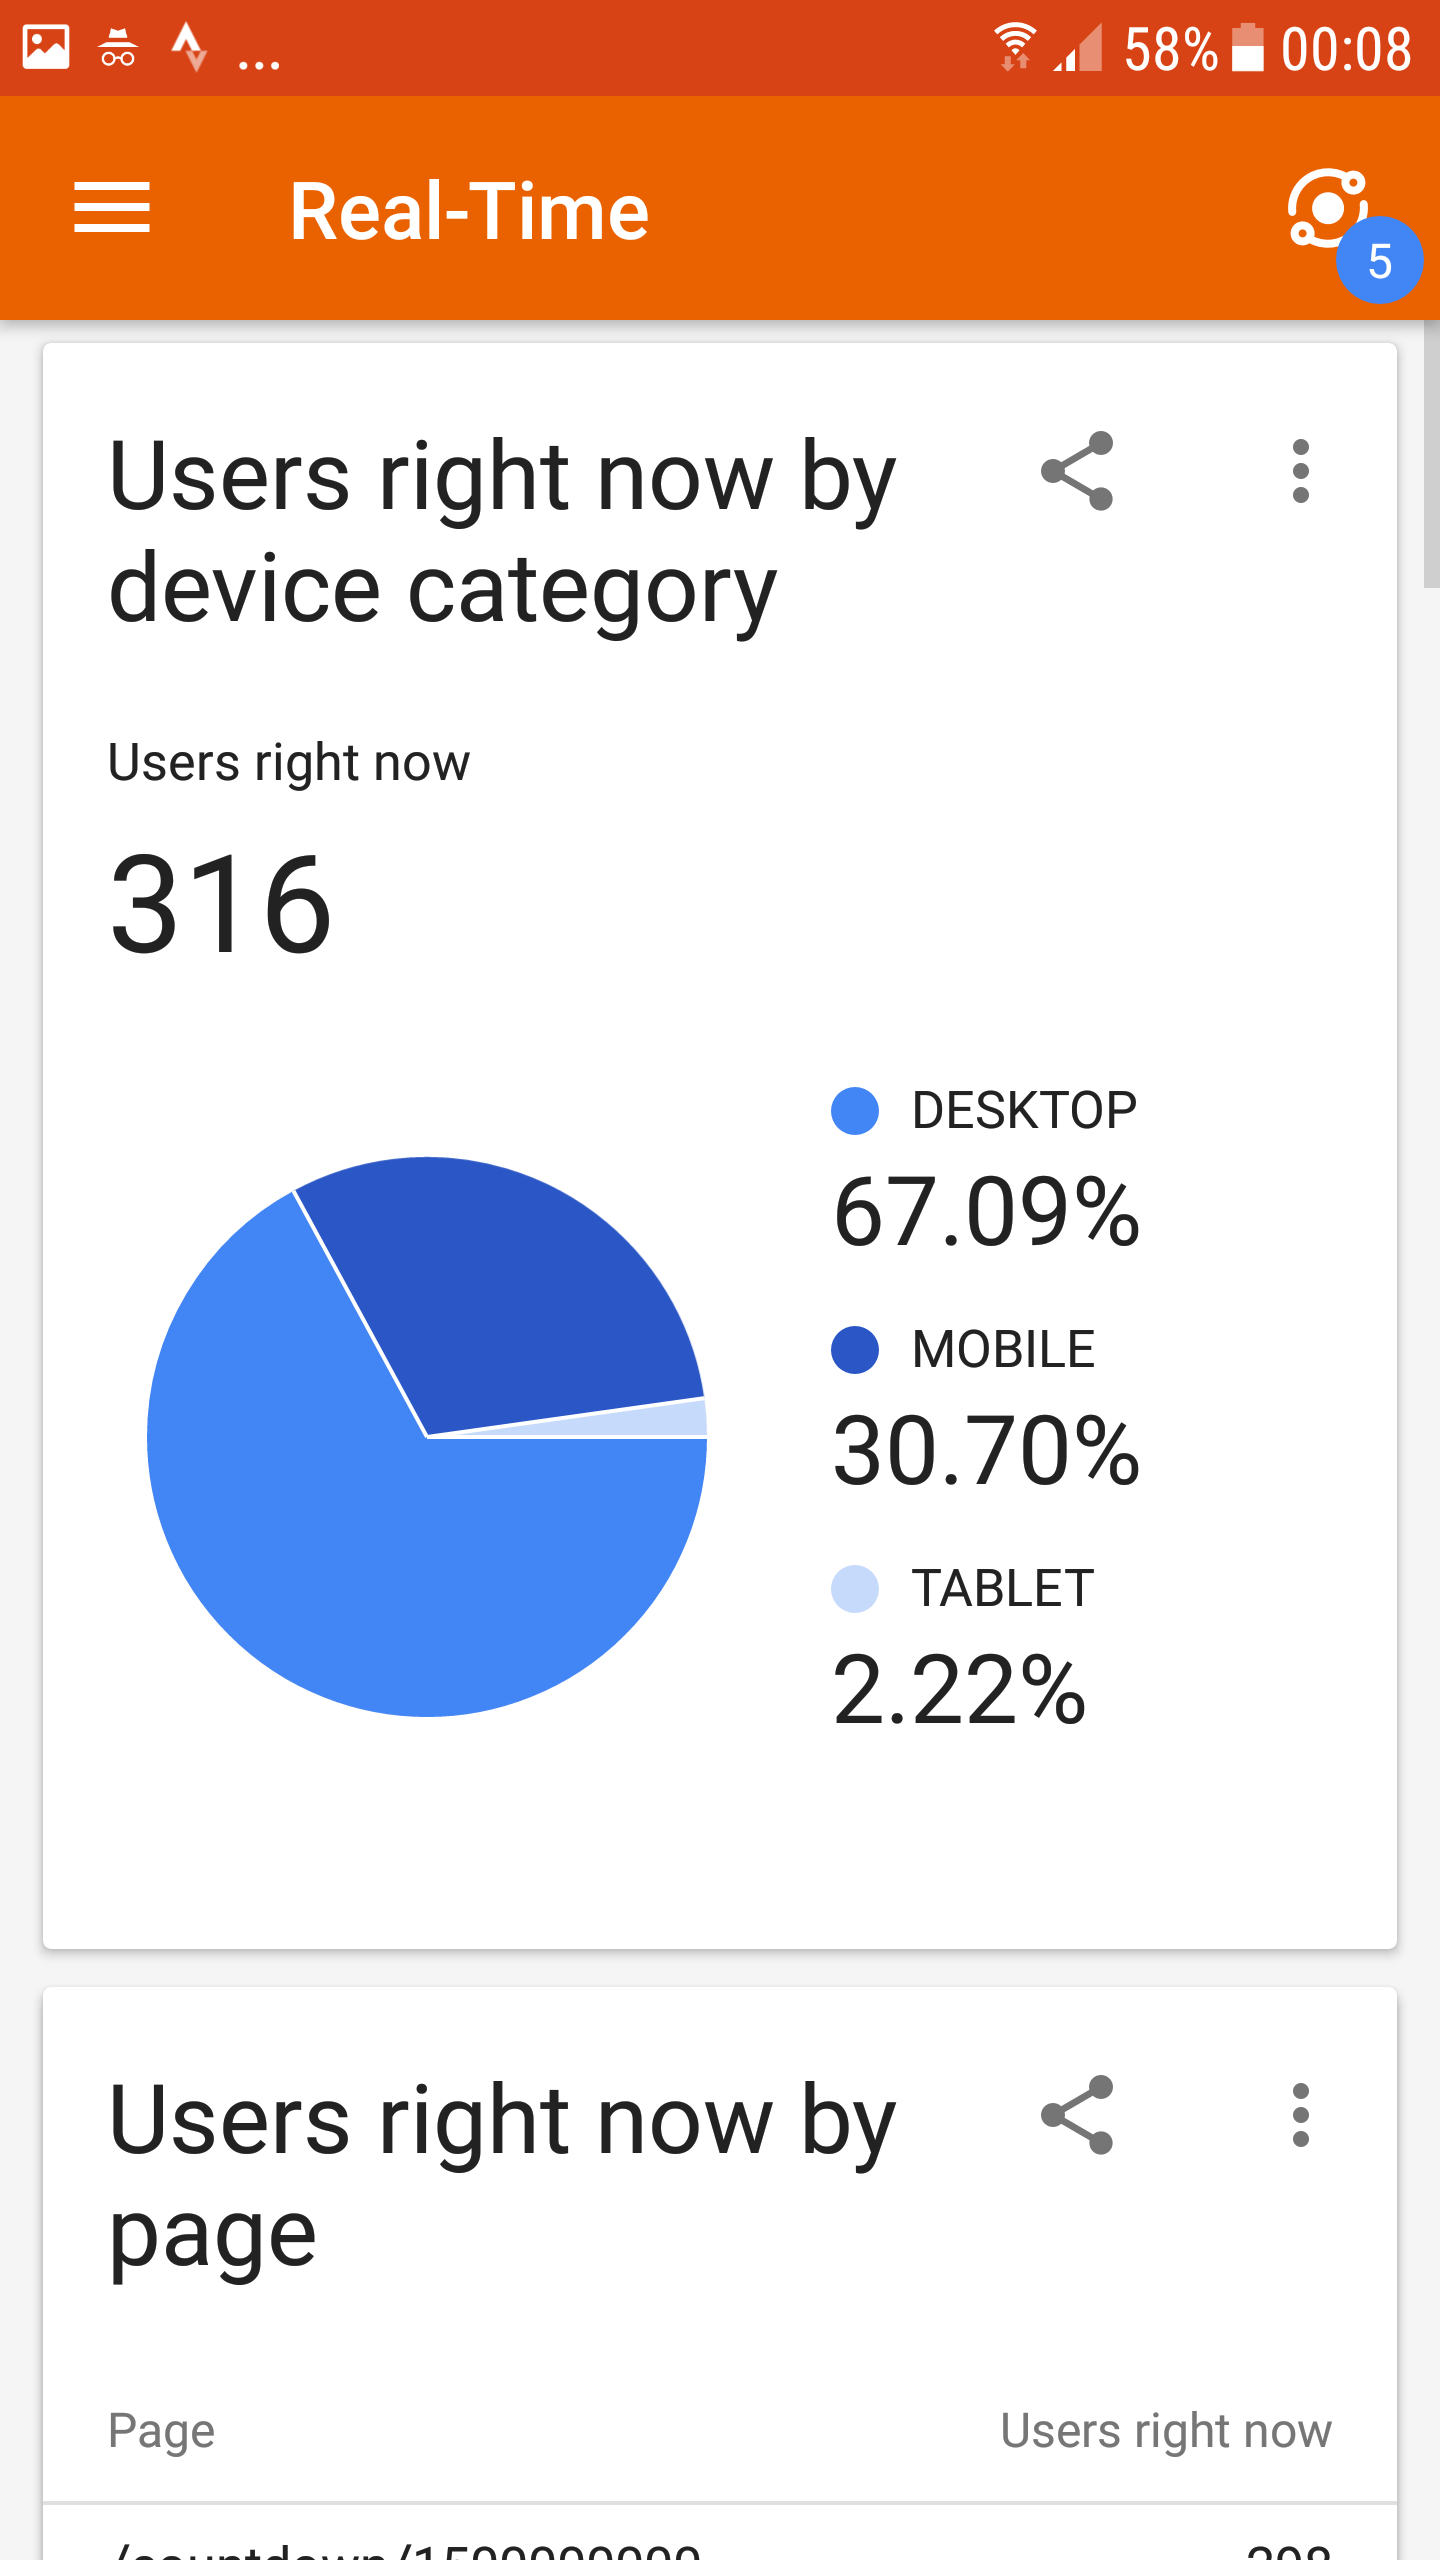
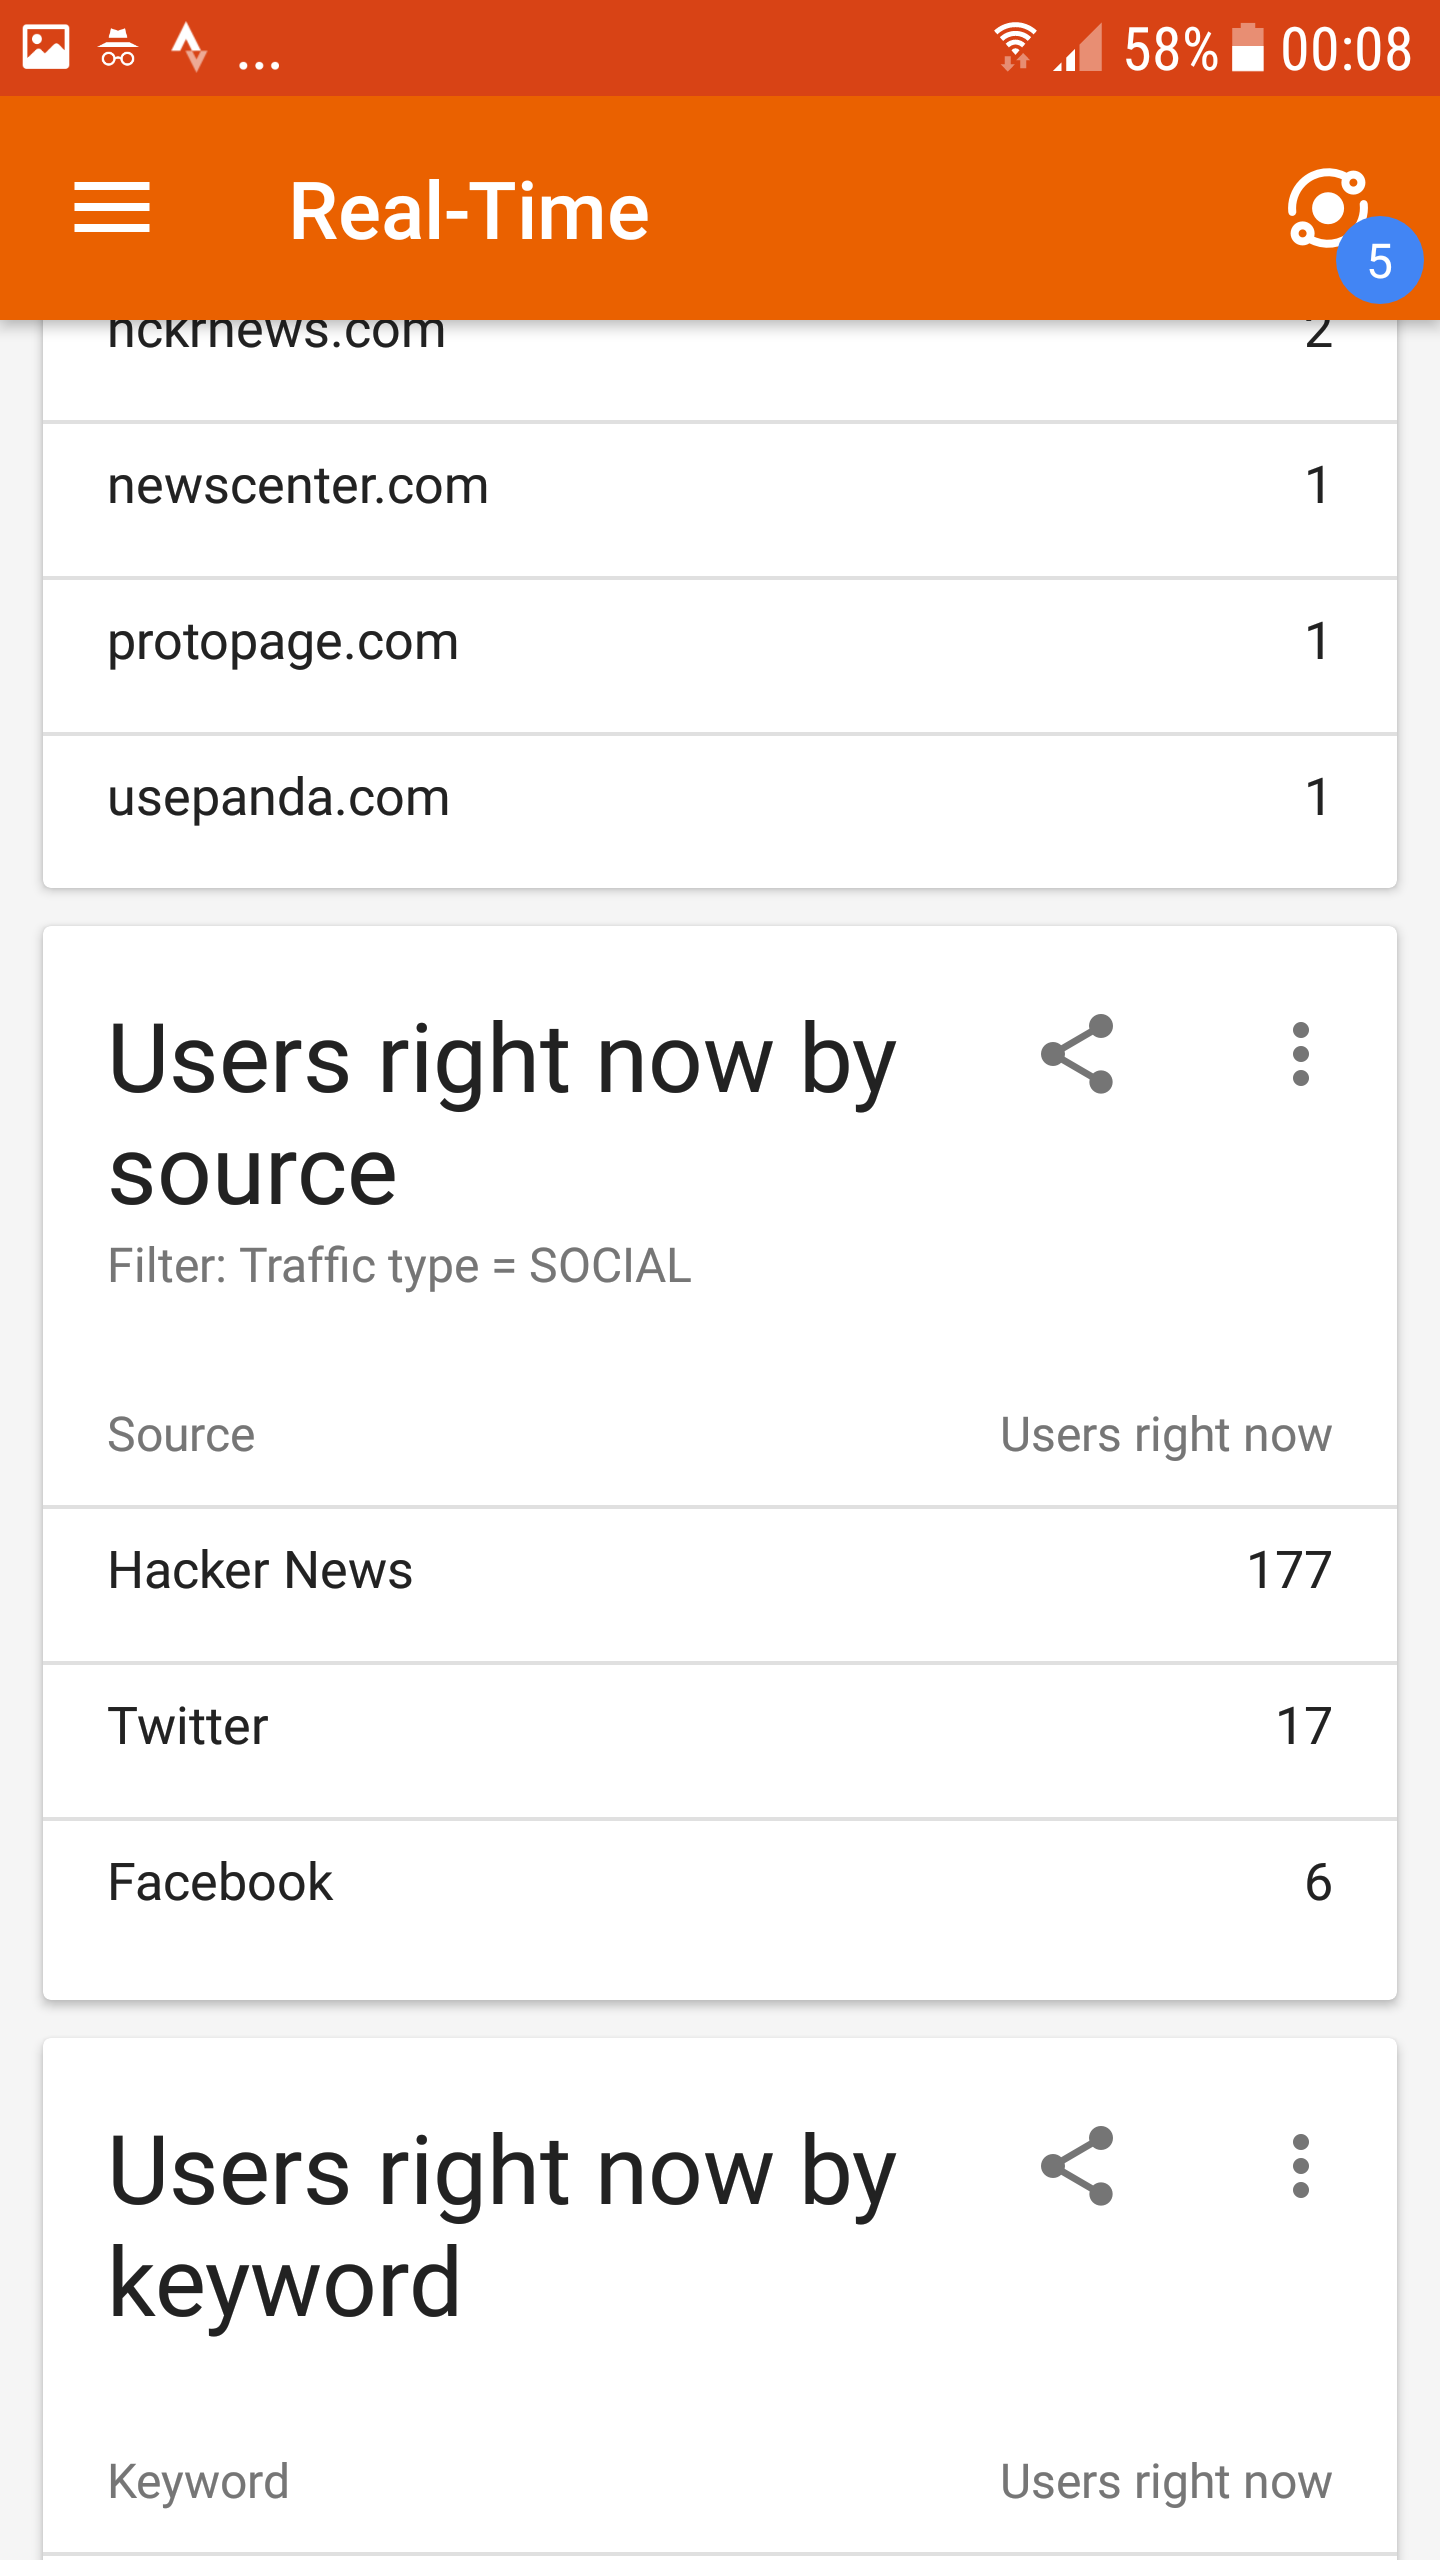
- 2017-07-14 00:08:39 – And source of traffic moved to other social networks:
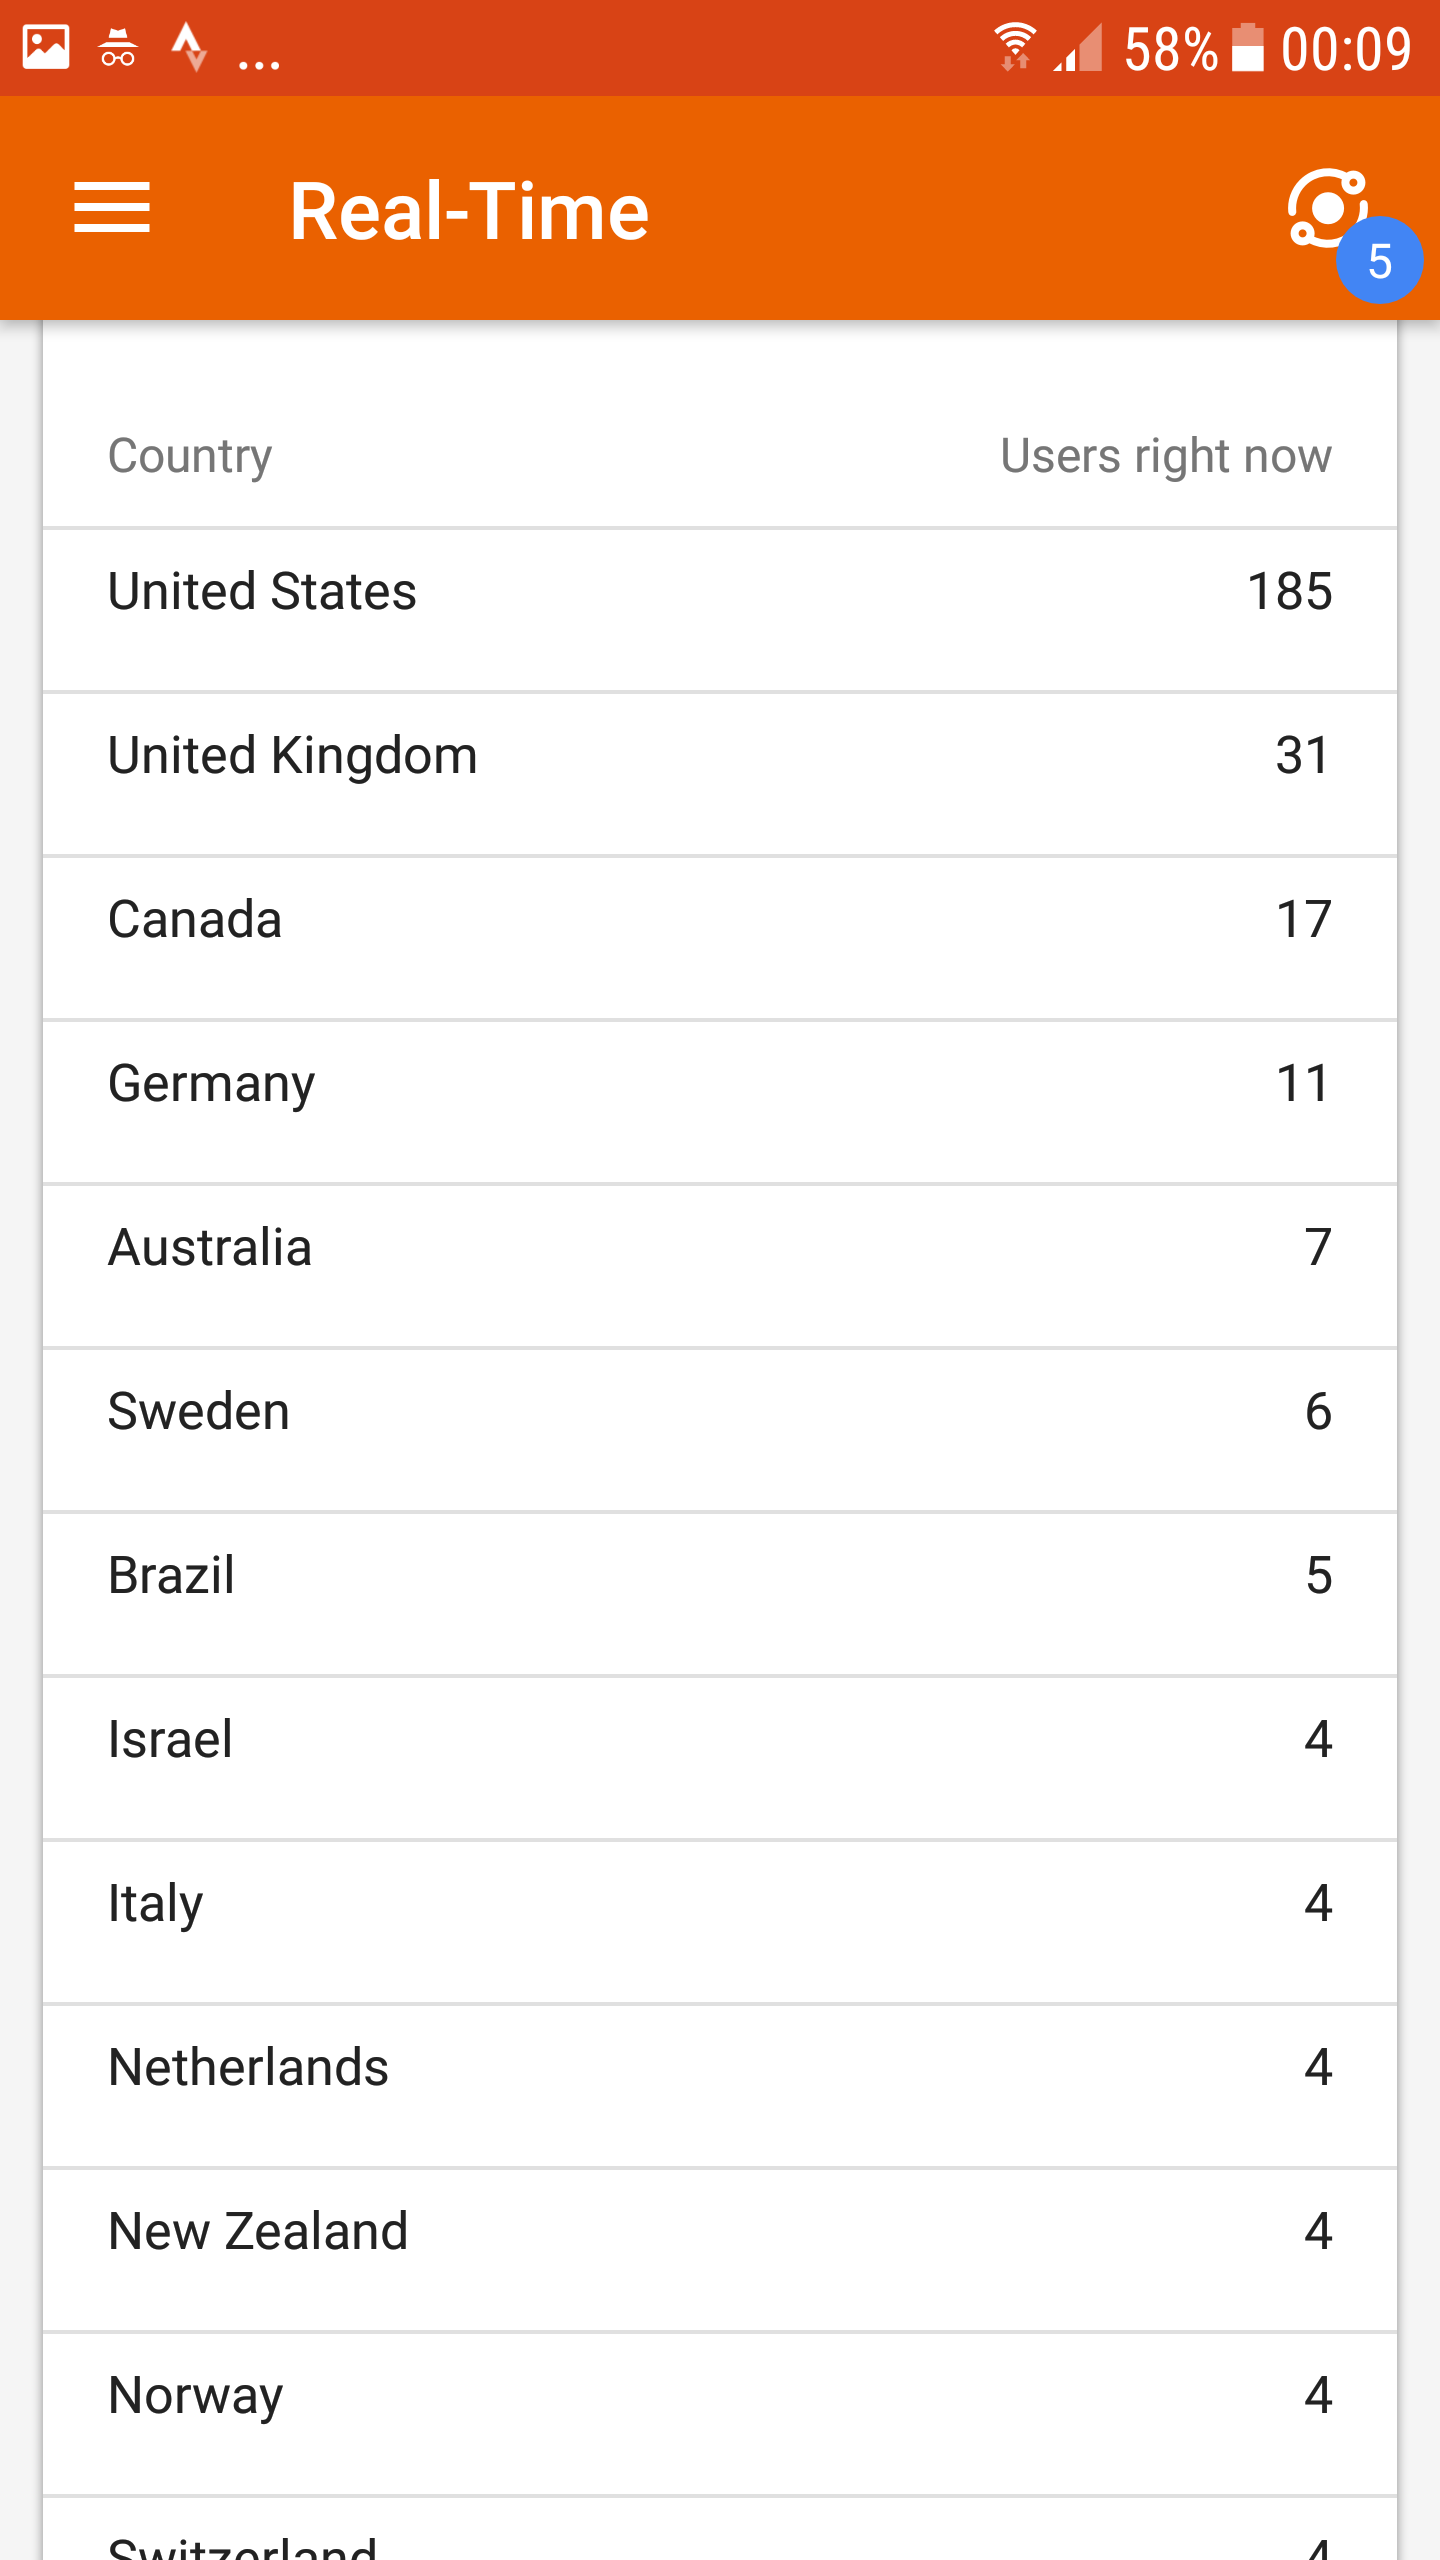
- Screenshot 2017-07-14 00:09:06 – Since it was midnight in Europe, it was kind of expected, that US will dominate active users:
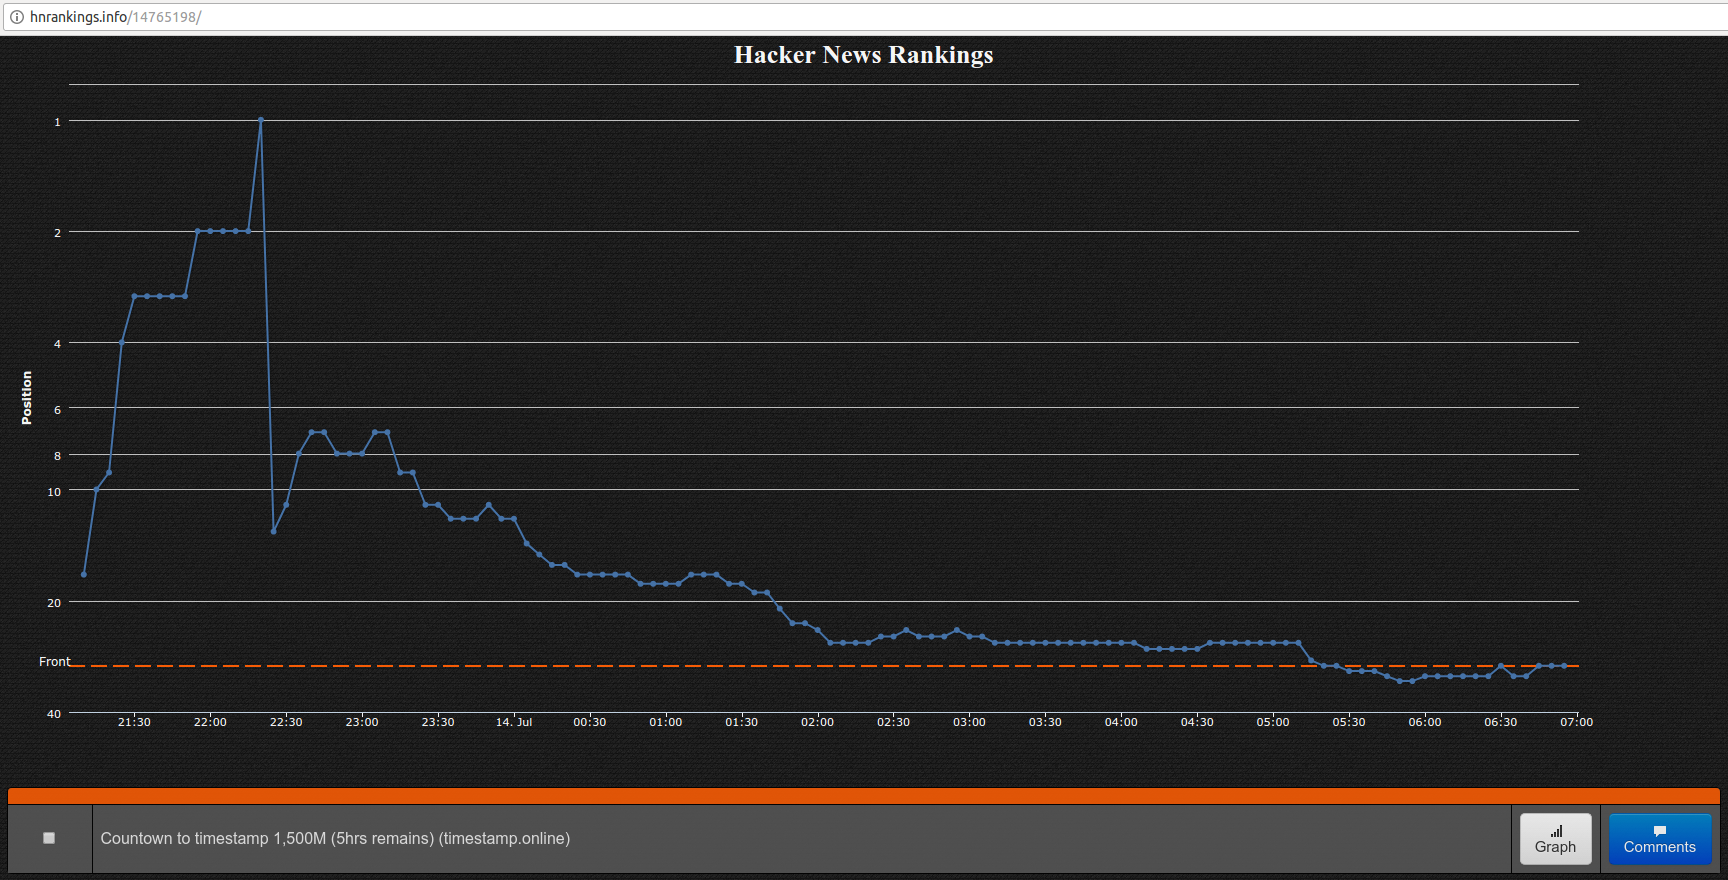
- 2017-07-14 00:17:48 – Link is gone from HP. Based on discussion in following thread it made sense that this link is not as valuable as announcement of Go 2 or research from Google about deep learning and therefore mods took it down.:

It never occurred to me, that I should scroll down to check if it’s somewhere lower. So I fall asleep. When I woke up, I have checked stats. There was still around 40 people there!!! It didn’t make any sense to me, how it’s possible that there are still people from hacker news, when I was taken down. I have checked Twitter Search and I have discovered, that there are many bots that will tweet the post when it reaches cerating rank or number of points. This is where I have discovered, that there is @hn_bot_top1 which tweets all stories, that reach first position. When I was looking for some other evidence, that the post was indeed first I have discovered HN Rankinings. This is where I have found out that I am still on first page.
Analysis
And now some analysis how many people visited timestamp.online, from where, and what is their equipment. Google Analytics is using PST, so there is 9 hours difference between times reported here and screenshots above.
In it’s peak there was 2,276 people during one hour and then it was slowly decreasing. Second spike happened, when it got shared on wykop.pl and after that 3k people from Poland visited it.
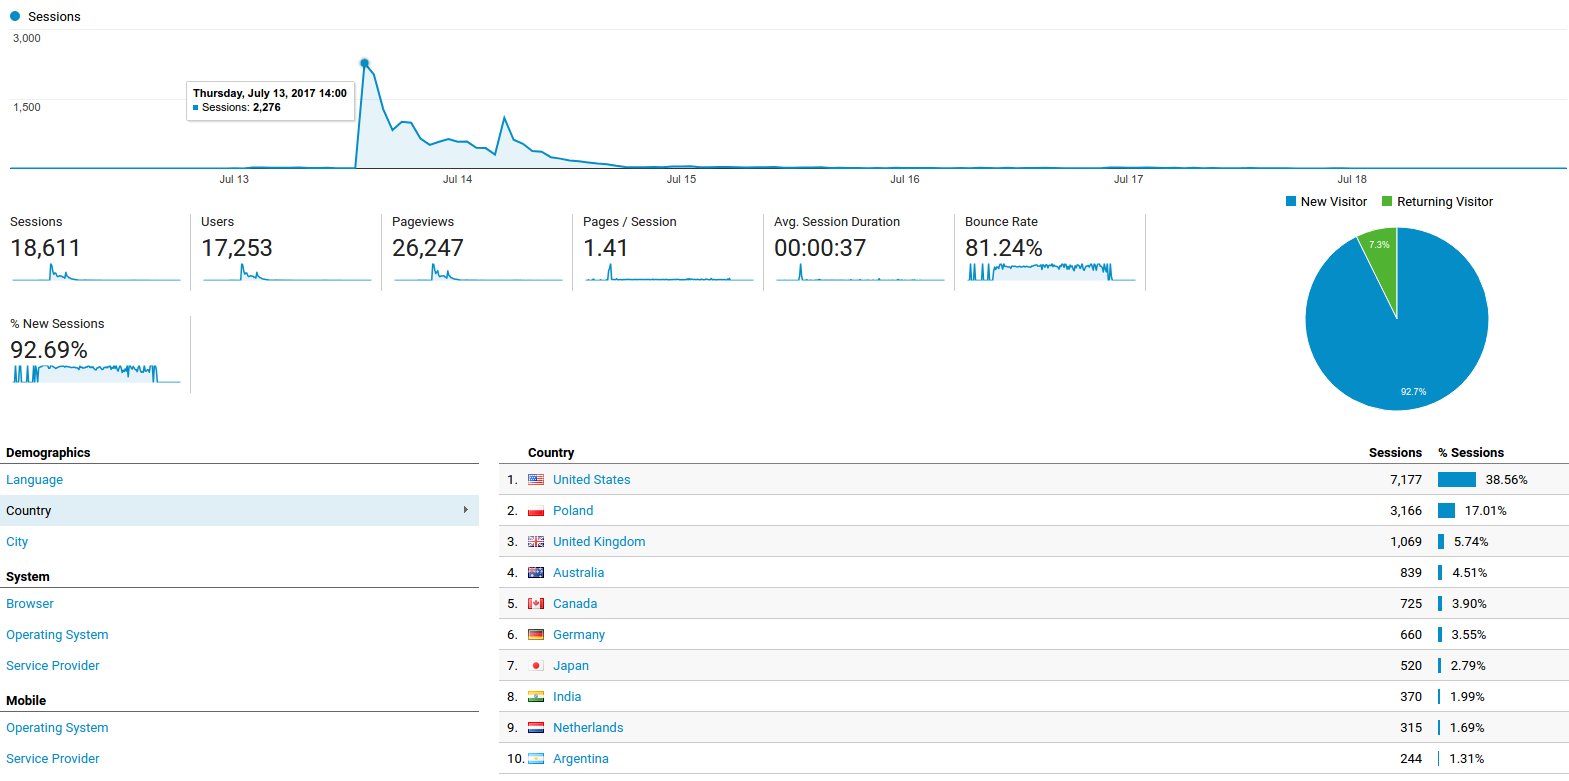
Location: 18,436
- USA: 38.69%
- Poland: 16.96%
- UK: 5.78%
- Australia: 4.53%
- Canada: 3.90%
- Germany: 3.55%
- Japan: 2.78%
- India: 2.78%
- Netherlands: 1.71%
- Argentina: 1.30%
Browser: 18,436
- Chrome: 61.14%
- Safari: 16.77%
- Firefox: 8.84%
- Android Webview: 7.08%
- Safari (in-app): 3.55%
- Edge: 0.77%
OS: 18,436
- Macintosh: 27.31%
- Windows: 23.92%
- Android: 22.48%
- iOS: 17.47%
- Linux: 8.31%
- Windows Phone: 0.20%
When I compare browser or OS with general population, I can see big differences. Even when compared with more developer focused websites, statistics for browser and OS looks differently. There is way more Macintosh users than there should be.
Referrers
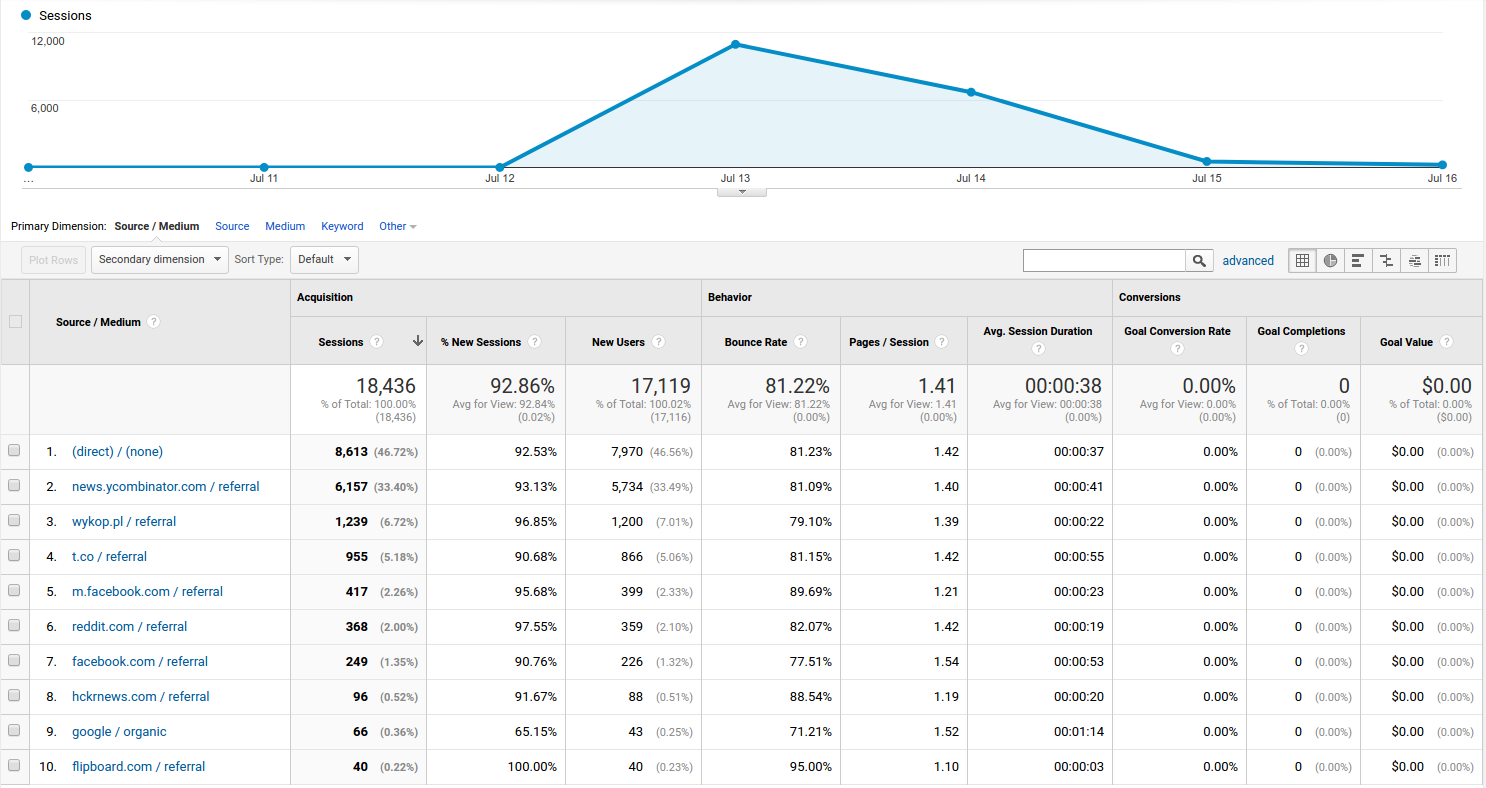
By Date
- 2017-07-12: 7
- 2017-07-13: 10,947
- 2017-07-14: 6,696
- 2017-07-15: 536
By Sources:
- None: 46.72%
- news.ycombinator.com: 33.40%
- wykop.pl: 6.72%
- t.co: 5.18%
- m.facebook: 2.26%
First, I was confused, why there is so many people with referrer Direct / None, but then I have learned, that it means, that there was no referrer nor cookie, so it’s most likely in-app browsers.
Source None (1): 8,613
- USA: 36.47%
- Poland: 22.20%
- Australia: 5.02%
- UK: 4.78%
- Germany: 3.25%
Source news.ycombinator.co (2): 6,157
How it was shared there.
- USA: 51.10%
- UK: 8.04%
- Canada: 5.23%
- Australia: 4.48%
- Germany: 3.85%
Source wykop.pl (3): 1,239
How it was shared there.
- Poland: 87.49%
- UK: 3.79%
- Germany: 2.58%
Source t.co (4): 955
How it was shared there.
- USA: 33.61%
- Japan: 28.90%
- UK: 5.03%
- Canada: 3.98
Source Reddit (6): 368
How it was shared there. It was very interesting to see, how the number of votes is going up and down all the time.
- USA: 27.45%
- Germany: 11.14%
- UK: 10.60%
- Netherlands: 5.16%
- Poland: 3.53%
Behavior
From 18k people at least 2k people clicked on something. I would expect this number to be lower.
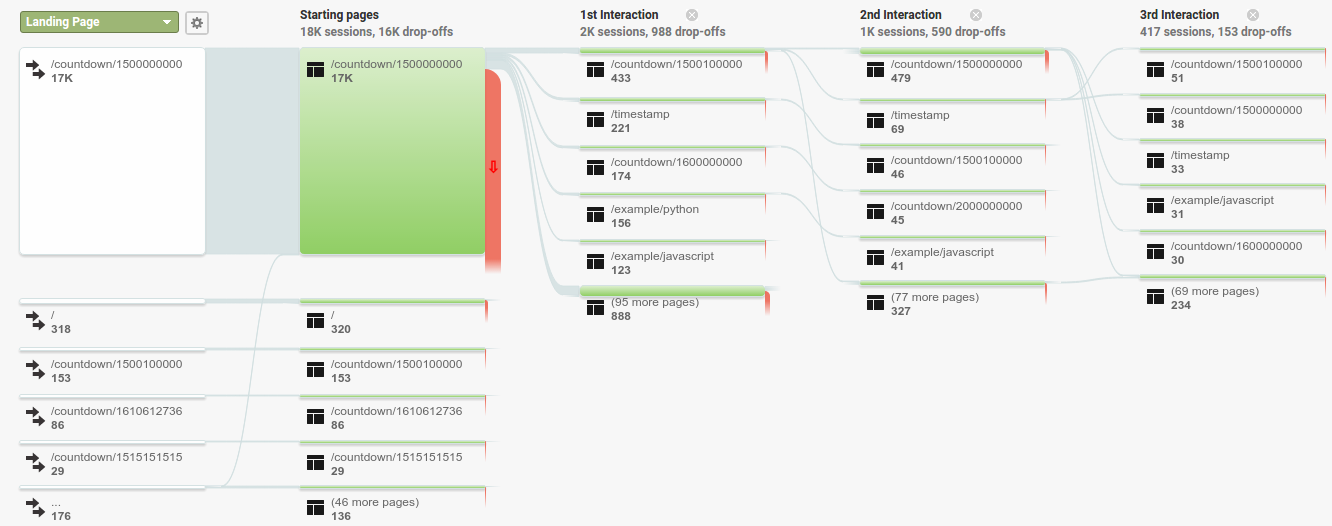
There are also links to my other sites where each of them got around 200 visits.
Hosting
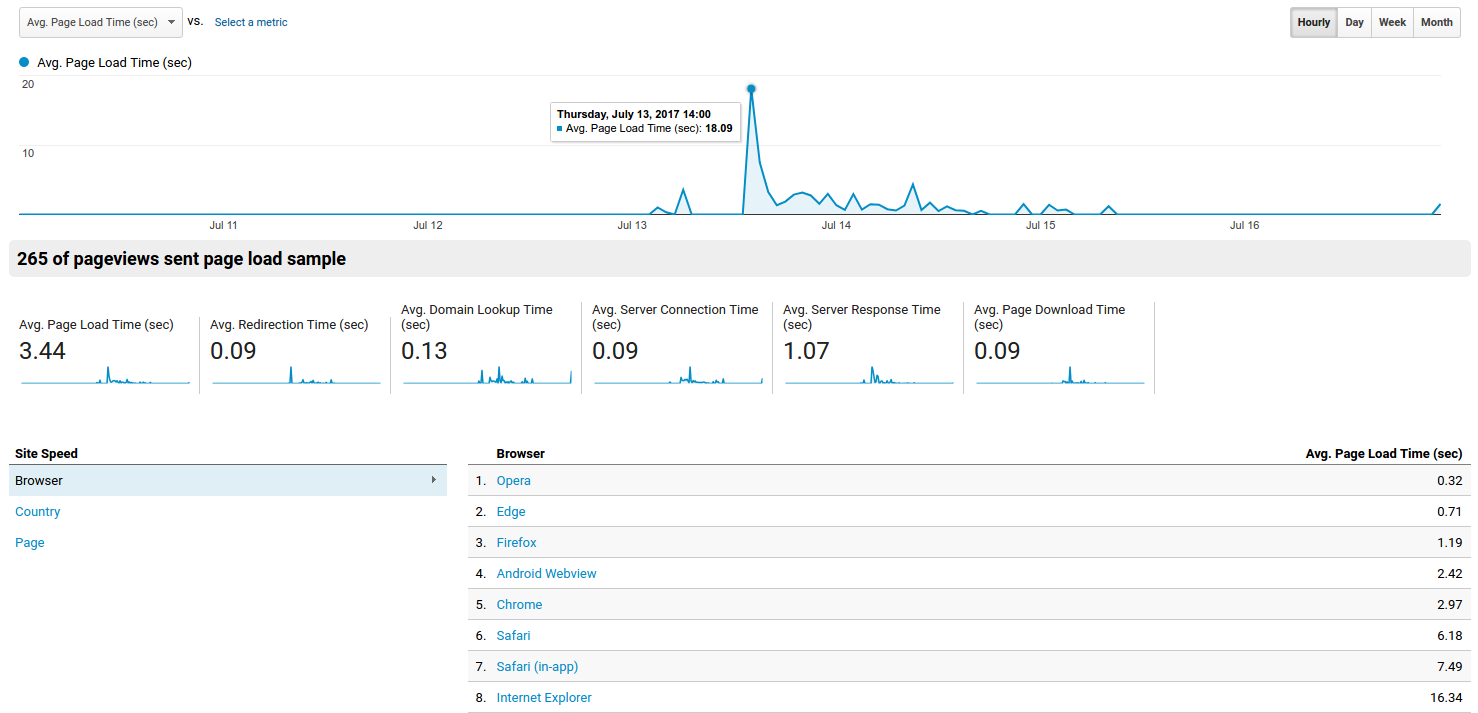
I have my websites on Savana with the cheapest plan Savana 500. Load on my VM increased from 0.4 to 20 in that moment. In GA I can see, that average page load time was increased to 18s. However, when I check different sections I can see only 4s as average time. It would be better to know p95 than average.
Further Analysis
If you want to check raw data you can check either raw logs or awstats with user public and password public. It may be interesting to look more closely how was the number of icomming people correlated with rank on hacker news or number of tweets. It’s also interesting, that awstats are showing completely different numbers than Google Analytics.
- Tags:
- google-analytics, hacker-news,
- Archive
- 2017-07-18